Kubernetes & Container Report report documentation
Provides an overview of Kubernetes (K8s) clusters, nodes, workloads, and resource utilization across AWS EKS, GCP GKE, and Azure AKS.

About this report
Monitor the health and security of your container environments across multiple cloud providers with unified visibility. Platform engineers can track cluster status, workload health, and resource utilization from a single dashboard regardless of where containers are running.

Key questions
- What is the health status of our Kubernetes clusters?
- Are our container workloads running properly?
- How is resource utilization distributed across our clusters?
- Where might we have container orchestration problems?
Visualizations in the report
Total active clusters
Counts your running Kubernetes environments across providers. This number establishes the baseline for your container infrastructure monitoring.

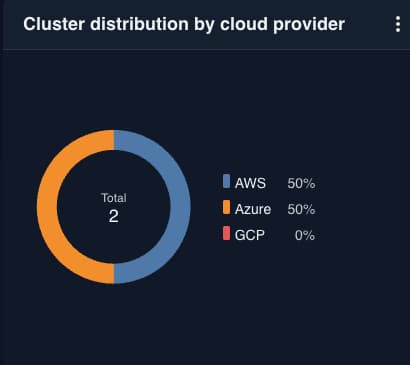
Cluster distribution by cloud provider
Shows how your Kubernetes footprint is distributed across AWS EKS, Azure AKS, and GCP GKE. Understand your container platform strategy at a glance.
Node count per cluster
Maps the size and capacity of each Kubernetes cluster. This visualization helps with capacity planning and scaling decisions.

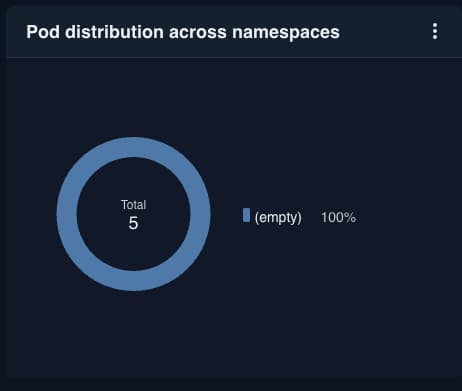
Pod distribution across namespaces
Analyzes workload organization within your clusters. See how applications and teams utilize your container platform.
Active vs. pending Pods
Highlights containers waiting for resources. Quickly identify scheduling bottlenecks or capacity issues

Unscheduled & failed Pods
Shows problematic workloads that will not run properly. Immediately spot applications experiencing issues that need attention.
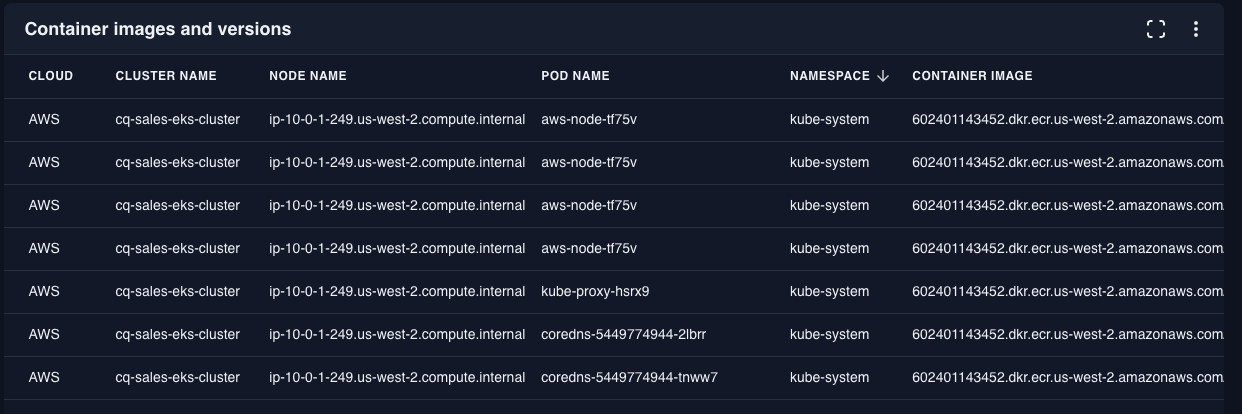
Container images and versions
Catalogs deployed container versions across your environment. Track which application versions are running in each environment.
Failed Kubernetes Jobs & CronJobs
Lists automation tasks that aren`t completing successfully. Quickly identify scheduled operations experiencing problems.
Cluster Autoscaler Events
Records scaling activities in your Kubernetes environments. Understand how your clusters adjust to changing resource demands.